
The basic idea of the weathermon project is to obtain, record and monitor the weather at my home. All weather data is sent from wireless sensors and then stored in a database, from which different graphs are generated that can be viewed on a PC, over the Internet and on a smartphone.
System Overview
- Weather data is measured by sensors outside and inside the house. These sensors transmit all measured values via radio link.
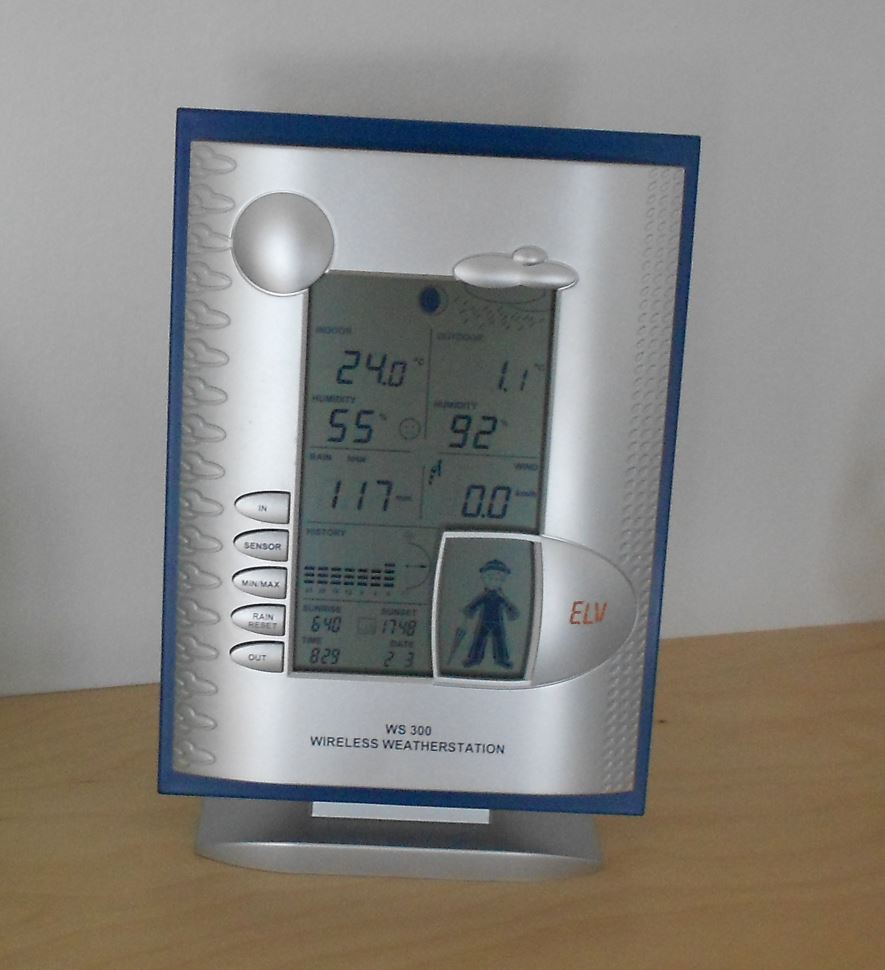
- Transmitted values are received by a weather station and displayed for convenience.
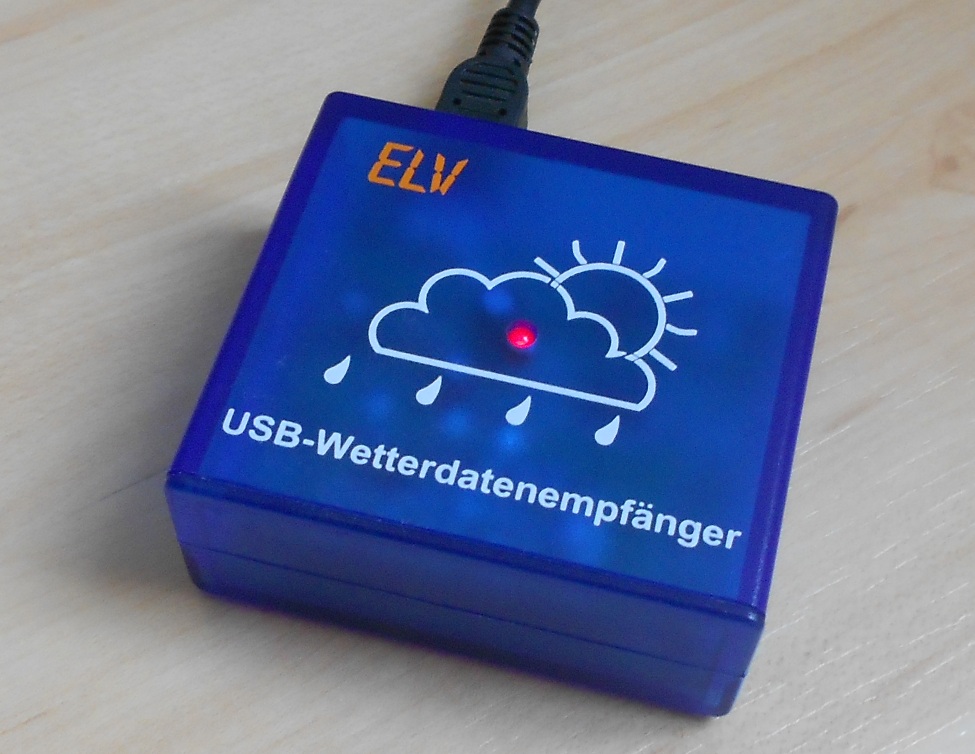
- Transmitted values are also received by a small USB device which sends them to the PC connected.
- The PC reads received measurements and stores them in a database.
- From this database a web server serves all measurements to clients for display.
Sensors
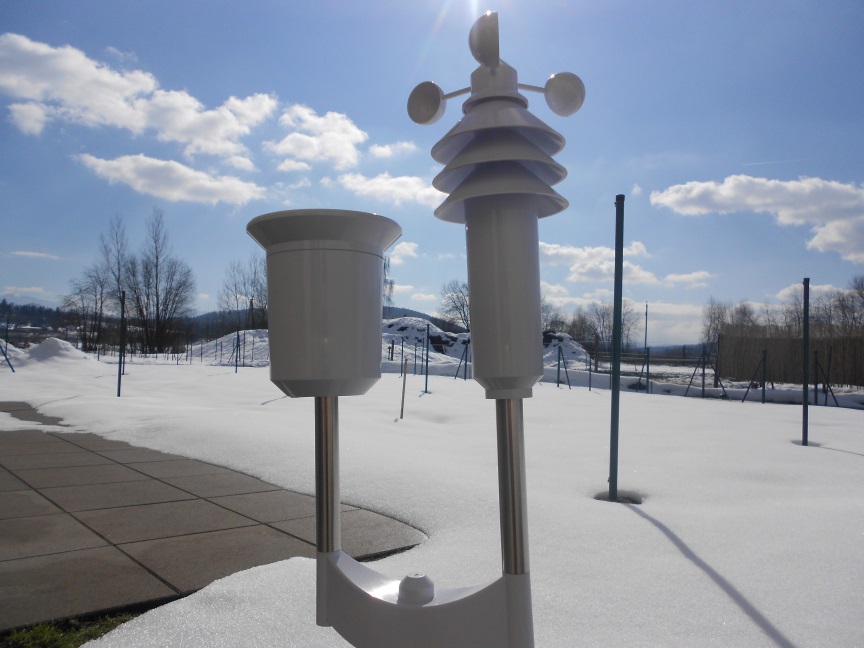
The sensors and the weather station come as a set from ELV:
- Outdoor sensor: ELV Funk-Kombi-Wettersensor KS300-2
- Indoor sensor: ELV Funk-Temperatur-/Luftfeuchteaußensensor S300 TH
- Weather station: WS 300
Receiver
For receiving the 868,35 MHz signals the following device from ELV is used:
Database
Data from weather sensors is stored in a Round Robin Database (RRDB) at different resolutions. This means, while high-resolution data is stored for the last 90 days, it also gets accumulated into daily data which is then kept for 10 years.
The database used is called RRDtool by Tobi Oetiker. It handles storing data at fixed intervals while updates come randomly, accumulating data and creating graphs.
Server
The server’s job is to run the database and web server, so that clients can connect with a browser and retrieve and display all weather data.
- The server is a standard Linux PC, but not a common desktop machine. Instead, a Raspberry PI is used.
- The server runs an Apache web server.
Interfaces
Protocol between Receiver and Server
The USB-WDE1 contains a CP210x serial-to-USB chip from Silicon Labs. Fortunately, Linux already contains a driver for that chip, so all that is needed is to plug the USB-WDE1 into the USB port. One can verify the driver is loaded correctly with lsmod:
pi@raspberrypi ~ $ lsmod
Module                  Size  Used by
cp210x                 11783  0
usbserial              34545  1 cp210x
From then on the USB-WDE1 will transmit a serial ASCII string whenever a new measurement has been received. This can be verified with the following commands:
stty -F /dev/ttyUSB0 9600
cat /dev/ttyUSB0
The ASCII string sent by the USB-WDE1 can look like this:
$1;1;;;;;;-3,8;;;;;;;;94;;;;-4,2;98;0,0;36;1;0
Which means:
- Temperature sensor address 5: -3.8°C
- Humidity sensor address 5: 94%
- Outside temperature: -4.2°C
- Outside humidity: 98%
- Wind speed: 0.0 km/h
- Rain intensity: 36 rocker switch impulses (equals 8.8mm/m²)
- Immediate rain detected
Software Components
Database Definition
The sensors send new data every 3 minutes. This data should be stored for the last 90 days. It should should also calculate daily minimum, maximum and average values. These shall be kept for 20 years.
The corresponding call to create the database is:
rrdtool create weatherdb.rrd --step 180 \
 DS:rain_total:GAUGE:180:0:4096 \
 DS:rain_detect:GAUGE:180:0:1 \
 DS:windspeed:GAUGE:180:0:2000 \
 DS:temp_out:GAUGE:180:-30:70 \
 DS:hum_out:GAUGE:180:0:100 \
 DS:temp_in:GAUGE:180:-30:70 \
 DS:hum_in:GAUGE:180:0:100 \
 DS:temp_pool:GAUGE:180:-30:70 \
 RRA:LAST:0.5:1:43200 \
 RRA:MIN:0.9:480:7300 \
 RRA:MAX:0.9:480:7300 \
 RRA:AVERAGE:0.5:480:7300
Filling Database
Serial data coming from the receiver must be interpreted and then stored into the database.
I wrote a short C program which basically does the following:
- Open serial port and set communication settings.
- Wait for and read a line from the USB-WDE1.
- Split the semi-colon-separated values into separate strings and replace the decimal separator (, with .).
- Call the
rrd_update_r()function to enter these values into the RRDB.
The complete C code can be found here: Weathermon.c.
To compile it I use the following short Makefile (note that it makes heavy use of predefined rules). Using an extra Makefile was only necessary for including the librrd.so library.
# predefined rule that compiles .c files into .o files: $(CC) $(LDFLAGS) n.o $(LOADLIBES) $(LDLIBS)
# predefined rule that links binary files from .o files: $(CC) -c $(CPPFLAGS) $(CFLAGS)

LDLIBS = /usr/lib/librrd.so

weathermon : weathermon.c
Visualization
When it came to visualization, the motivation left me. I’m no designer, no expert for HTML, CSS and PHP. So I did what was necessary to view the weather data, but did not add any nice design or comfortable features.
The index.html just consists of a series of <img src="img_temp_out.php"/> tags that create the different diagrams.
img_temp_out.php for example looks like this:
<?php
 $start = isset($_GET['start']) ? escapeshellarg($_GET['start']) : "end-1d";
 $end = isset($_GET['end']) ? escapeshellarg($_GET['end']) : "now";

header("Content-Type: image/gif");
 passthru("rrdtool graph - \
 --title 'Außentemperatur' \
 --vertical-label °C \
 --start $start --end $end \
 --width 480 \
 --slope-mode \
 DEF:temp_out=/home/pi/weather/weatherdb.rrd:temp_out:LAST LINE2:temp_out#FF0000 \
 DEF:temp_pool=/home/pi/weather/weatherdb.rrd:temp_pool:LAST LINE2:temp_pool#0000FF");
 ?>
I calls rrdtool with the appropriate parameters, which then creates the GIF image and outputs it to stdout. From there it is directly copied into the web server’s response to the client.

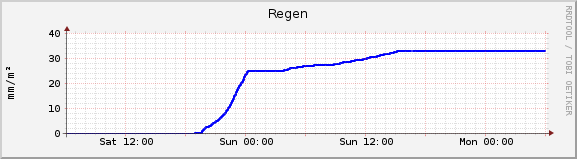 A very interesting diagram is the amount of rain. Instead of calculating a “rain per hour” value, meteorologists usually draw the curve of the total amount of rain. From this kind of diagram one can quickly read the amount of rain in a certain period of time, such as rain in the last 24 hours. But it also allows to tell with high accurancy, when peaks in rain intensity occurred.
For this diagram it is necessary to define a “virtual” datasource that obtains the minimum value from the data. This minimum value is then substracted from each value, effectively causing the graph to start at 0. Finally, each value has to be multiplied with 0.295 because each rocker switch impulse equals 0.295 mm/m² rain (the rain sensor just sends the number of switch transitions).
<?php
$start = isset($_GET['start']) ? intval($_GET['start']) : time() - 24 * 60 * 60;
$end = isset($_GET['end']) ? intval($_GET['end']) : time();
$interval = $end - $start;

header("Content-Type: image/gif");

// we show 3min values
passthru("rrdtool graph - \
--title 'Regen' \
--vertical-label mm/m² \
--units-exponent 0 \
--start $start --end $end \
--width 480 \
DEF:totalrain=/home/pi/weather/weatherdb.rrd:rain_total:LAST \
VDEF:minrain=totalrain,MINIMUM \
CDEF:rain=totalrain,minrain,-,0.295,* LINE2:rain#0000FF");

?>
Conclusion
The system works, so the project was a success. The family checks the outside temperature on the weather station every day. All weather data is also written to the database and after extreme weather conditions I enjoy to observe these on the diagrams too. On the visualization side much more could be done, though.